Two slots can carry the exact same RTP printed on their information screen — say 96% — and still feel like completely different games. One pays out small amounts almost every spin and barely moves your balance. The other stays flat for long stretches, then suddenly doubles or wipes out your session in a handful of spins. The reason has nothing to do with RTP itself. It comes down to volatility, a separate statistic that RTP does not capture at all.
What RTP Actually Means
Return to Player (RTP) is a theoretical, long-run average. A 96% RTP means that, across millions of simulated spins, the game is designed to return 96 cents for every dollar wagered, with the remaining 4% representing the house edge. Regulators such as the UK Gambling Commission require this figure to be calculated from the full pay table and probability model of the game, not from short-term observed results.
The key word is theoretical. RTP tells you almost nothing about what a single session of 50, 100, or even 500 spins will look like. Two games can converge on the same 96% figure over millions of spins while producing wildly different short-term experiences. That gap between the long-run average and the short-run outcome is exactly what volatility describes.
What Volatility (Variance) Actually Means
Volatility — also called variance — measures how spread out a game’s payouts are around its average. In statistical terms, it is typically expressed as the standard deviation of outcomes per spin. A game with low standard deviation pays close to its average result most of the time. A game with high standard deviation swings far above and below that average, even though the average itself is unchanged.
Two concrete numbers make this tangible, as detailed in UNLV’s paytable analysis:
- Hit frequency — the percentage of spins that return any win at all, regardless of size.
- Standard deviation — how far individual outcomes typically deviate from the average result.
A slot can have a high hit frequency (you win often) but a low average win size, which produces low volatility. Or it can have a low hit frequency (you win rarely) but a very large maximum win multiplier, which produces high volatility. Neither of these numbers is visible in the RTP figure — RTP is simply the weighted average of every possible outcome, hit or miss, big or small.
Why the Same RTP Can Feel Completely Different
This is where the two content gaps meet. RTP describes the center of the payout distribution. Volatility describes its spread. You can build two games with an identical mathematical center — 96% — while giving them completely different spreads:
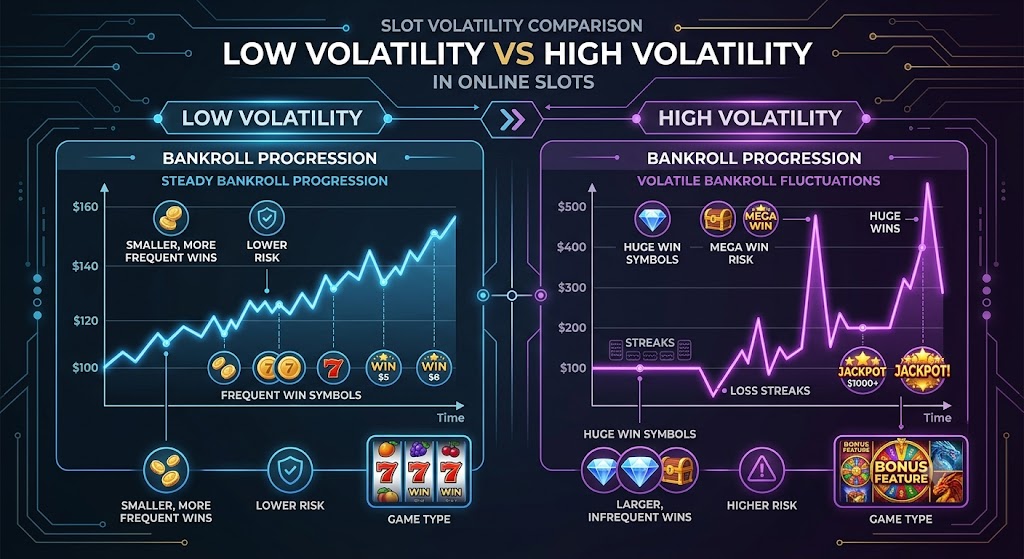
- Game A (low volatility): wins land on roughly 45% of spins, most between 0.2x and 2x the bet. Losses are frequent but small, wins are frequent but small too. The balance line stays close to flat.
- Game B (high volatility): wins land on roughly 12% of spins. Most of those wins are modest, but a small fraction pay 20x, 50x, or more. The balance line stays flat for long stretches, then jumps or drops sharply.
Run each of these thousands of times and the average result converges to the same 96%. This is simply the law of large numbers at work — over a long enough sample, both distributions settle on their theoretical mean. But no player experiences millions of spins in a session. A typical session of a few hundred spins is far too short for the “long run” to apply, which is exactly why the short-term ride feels nothing alike between the two games, even with identical RTP.
Low, Medium, and High Volatility Explained
Low Volatility
Low-volatility mechanics are built around frequent, small payouts. Typical design choices include a high number of paylines or ways-to-win, low-value symbol combinations that trigger often, and a capped maximum win multiplier (commonly in the tens rather than hundreds of times the bet). Hit frequency is usually well above one in three spins. The bankroll curve stays close to a flat or gently sloping line, since no single spin can move the balance very far in either direction.
Medium Volatility
Medium-volatility games sit between the two extremes. They combine a moderate hit frequency with occasional mid-sized wins and a bonus feature that pays meaningfully more than the base game. The bankroll curve shows noticeable ups and downs but rarely swings to extremes in a short session. This is the profile most general-purpose slots aim for, balancing entertainment value with manageable risk.
High Volatility
High-volatility mechanics are built around rare, large payouts. Design choices typically include a low base hit frequency, a heavy reliance on a bonus round or free-spins feature to deliver most of the RTP, and an uncapped or very high maximum win multiplier (hundreds or thousands of times the bet). Long dry spells with no win are normal and expected, not a sign anything is wrong with the game. The bankroll curve is flat for extended periods, punctuated by sharp spikes or drops.
| Volatility | Hit Frequency | Typical Max Win | Bankroll Curve |
|---|---|---|---|
| Low | High (~40–50% of spins) | Tens of times the bet | Flat, gradual movement |
| Medium | Moderate (~20–30% of spins) | Hundreds of times the bet | Moderate swings |
| High | Low (~10–15% of spins) | Thousands of times the bet | Long flat stretches, sharp spikes |
Mechanic Types and Where They Typically Land
Volatility is a design outcome, not a fixed property of a game category, but certain mechanic types tend to cluster around particular volatility levels because of how their pay tables are structured:
- Classic three-reel, single-payline formats tend to sit on the low end, since a small number of possible winning combinations keeps the payout distribution tight.
- Ways-to-win and multi-payline video slots commonly land in the low-to-medium range, since more winning combinations per spin raise hit frequency.
- Cluster-pays and cascading-reels mechanics, where symbols disappear and new ones drop in after a win, often sit in the medium range, since a single spin can chain multiple smaller wins together.
- Megaways-style mechanics, which randomize the number of symbols per reel each spin, typically push toward medium-to-high volatility because the number of possible winning combinations itself fluctuates.
- Bonus-buy features, which let a player pay a flat fee to skip straight into a bonus round, do not change the underlying volatility of that bonus round itself, but they concentrate a player’s spend into the highest-variance portion of the game, which is why they are almost always attached to high-volatility titles.
None of this is a hard rule — volatility is ultimately set by the pay table and probability model, not the visual mechanic — but these patterns are consistent enough to use as a rough first filter when a paytable or volatility rating isn’t available.
Progressive Jackpots: The Extreme Edge of Volatility
Progressive jackpots represent volatility taken to its logical extreme. A small portion of every wager across a linked network of machines feeds a jackpot pool that grows until one spin, often at odds of many millions to one, pays it out in full. Hit frequency for the jackpot itself is effectively negligible, and the “win” side of the distribution is dominated by a single, enormous outlier rather than a range of moderate big wins. This is also why a progressive jackpot slot’s overall RTP figure can be misleading in isolation: it typically blends a lower base-game RTP with the statistical contribution of the jackpot, which the vast majority of sessions will never touch. Progressive jackpots are not a separate category from the low/medium/high framework — they are simply the far end of the high-volatility spectrum, with hit frequency and standard deviation pushed to their statistical limits.
How Volatility Should Shape Your Bankroll Strategy
Because RTP only describes the long-run average, it is volatility — not RTP — that should drive practical bankroll decisions. The relevant question is not “what will I win on average” but “can my bankroll survive the swings before the average has a chance to show up.”
Bet Sizing
On high-volatility games, smaller individual bets relative to total bankroll allow more spins to pass, which matters because the dry spells between wins are longer and hit frequency is lower. On low-volatility games, bet size can be scaled up relative to bankroll since the payout distribution is tighter and dramatic drawdowns are less likely.
The formal concept behind this is risk of ruin — the statistical probability that a bankroll is exhausted before a session ends, given a bet size, a starting bankroll, and a game’s volatility profile. Risk of ruin rises sharply as bet size increases relative to bankroll, and it rises independently as volatility increases, because larger standard deviation means any given losing streak can run longer and deeper before the theoretical RTP has a chance to reassert itself. The same starting bankroll can carry a comfortably low risk of ruin on a low-volatility game and a high risk of ruin on a high-volatility game, even at an identical bet size and identical RTP.
Session Length
Low-volatility games suit shorter, steadier sessions or players prioritizing playtime over big-win potential, since outcomes stay close to the average even over a modest number of spins. High-volatility games generally need a longer number of spins, and a bankroll sized to match, before the theoretical RTP has any real chance to express itself. Ending a high-volatility session early, right in the middle of a dry spell, tells you nothing about the game’s long-run RTP.
Bankroll-to-Bet Ratio
A common approach used in bankroll-management guidance is to size the bankroll as a multiple of the bet, with that multiple scaled to volatility: a smaller multiple for low-volatility games, and a substantially larger multiple for high-volatility games to absorb extended dry spells without running out of funds before a big payout has a statistical chance to land. The exact numbers vary by risk tolerance, but the direction is consistent: higher volatility requires a proportionally larger bankroll buffer, not a bigger single bet.
Try It Yourself: Volatility Simulator
The calculator below simulates a bankroll curve over roughly 200 spins for a chosen volatility level, holding RTP constant. Notice how the low-volatility line stays close to flat while the high-volatility line swings sharply — even though both are simulated at the same underlying RTP.
A Note on Responsible Play
Understanding RTP and volatility explains how a game’s mathematics behaves — it is not a strategy for beating the house edge, which remains built into every game regardless of volatility level. Regulators such as the Malta Gaming Authority require licensed operators to provide player-protection tools, including deposit limits, session reminders, and self-exclusion options. High-volatility play in particular can produce long losing streaks that feel personal or “unlucky” even though they are a statistically normal feature of the game’s design, which is worth keeping in mind when setting a budget before a session starts rather than during one.
Common Misconceptions
A few ideas worth correcting explicitly, since they come up often in player discussions and forums referenced by industry analysts:
- “A machine is due for a win.” This is a textbook example of the gambler’s fallacy — the mistaken belief that past independent outcomes influence future ones. Each spin on a properly certified random number generator is independent of previous spins. A long dry spell does not increase the probability of the next spin winning, no matter how long the streak has run.
- “Higher RTP always means a better game to play right now.” RTP is a long-run average across the entire lifetime of a game. It says nothing about whether the next hundred spins will be above or below that average — volatility is what determines how far outcomes can drift from it in the short term.
- “Low volatility means a weaker game.” Low volatility simply means a tighter payout distribution. It is a design choice suited to different goals (longer playtime, smoother sessions), not an inferior mathematical model.
Frequently Asked Questions
Is volatility the same thing as RTP?
No. RTP is the theoretical long-run average percentage returned to players. Volatility (variance) describes how spread out individual outcomes are around that average. Two games can share an identical RTP while having completely different volatility profiles.
Can a low-RTP game still be low volatility?
Yes. RTP and volatility are independent variables. A game’s RTP is set by its overall pay table design, while volatility is set by how those payouts are distributed across hit frequency and win size. Any combination of RTP and volatility is mathematically possible.
How long does it take for RTP to “show up” in a session?
This depends heavily on volatility. Low-volatility games converge toward their theoretical RTP over relatively fewer spins because outcomes are tightly clustered. High-volatility games require dramatically more spins before the observed return reliably approaches the theoretical RTP, since a small number of large, rare payouts carry a disproportionate share of the long-run average.
Does higher volatility mean a lower house edge?
Not necessarily. House edge is derived directly from RTP (house edge = 100% − RTP) and is unrelated to volatility. A high-volatility game can have the same house edge as a low-volatility game; only the shape of the payout distribution differs.
How should I choose a volatility level for my bankroll?
As a general rule, size the bankroll relative to volatility: smaller buffers can work for low-volatility games because outcomes stay close to average, while high-volatility games need a substantially larger buffer to survive extended dry spells before a large payout has a realistic chance to occur.
What is “risk of ruin” and how does it relate to volatility?
Risk of ruin is the statistical probability that a bankroll is exhausted before a large enough sample of spins allows the theoretical RTP to reassert itself. It increases with bet size relative to bankroll and increases independently with volatility, since higher standard deviation means losing streaks can run longer and deeper before the average result shows up.
Are progressive jackpot slots just an extreme version of high volatility?
Yes. Progressive jackpots push hit frequency and standard deviation to their statistical extremes: the jackpot itself lands at odds of many millions to one, while a small portion of every wager across a linked network feeds the growing prize pool. They sit at the far end of the same low/medium/high volatility spectrum rather than forming a separate category.
Sources & Further Reading
- UK Gambling Commission — How to calculate Return to Player (RTP)
- UK Gambling Commission — Return to Player: how much gaming machines payout
- Wikipedia — Return to Player
- Wikipedia — Gambling Mathematics
- Wizard of Odds — The House Edge
- UNLV International Gaming Institute — Understanding the Paytable (Par, Hit Frequency, Standard Deviation)
- Malta Gaming Authority — Player Protection