Why is Bitcoin falling? What is behind the slide to $82,700

Bitcoin is falling because leveraged longs got flushed out while macro pressure kept building: hawkish Fed minutes, oil above $101 and rising Treasury yields. BTC fell 1.8% to about $82,653 on October 8, moving into the $82,000 support zone. That is roughly 3% below where it traded on October 6. Below is what is driving the move and where traders are watching next.
Liquidations did the first round of damage
The sell-off started with leverage. A cascade on October 7 liquidated about $546 million in positions, around 88% of them longs. Open interest in perpetual futures is still elevated at about $68 billion, which means a modest price move can trigger further forced selling.
Hawkish Fed minutes, oil and yields
The macro picture got heavier overnight. The move followed hawkish Federal Reserve minutes, higher oil prices and rising Treasury yields, and oil is trading above $101. Higher yields tend to pull money out of risk assets, and bitcoin usually feels it quickly. Traders are also looking ahead to September CPI on October 14.
ETF outflows grew
Spot Bitcoin ETFs recorded a $487 million net outflow on October 7. That is a sharp reversal from the inflows earlier in the week and shows institutional demand wavering.
One counterpoint
Not everyone is selling. Large holders added over 14,000 BTC since October 1. Sentiment has cooled but is not in panic: the Fear & Greed Index sits at 64.
How low can Bitcoin go?
Nobody knows. These are the levels analysts are tracking right now.
| Price (USD) | Why it matters |
|---|---|
| 86,683 to 86,974 | Resistance cluster. Clearing it would reopen the upside. |
| 83,861 to 84,432 | Band BTC needs to reclaim on a daily close to signal recovery. |
| 82,000 to 83,000 | Current support zone being tested. |
| about 82,566 | September 28 low, exposed on a daily close below $82,720. |
| about 80,840 | September 21 low. |
| 80,000 | Psychological level. A break below it could weaken the bullish setup. |
| 70,000 | Deeper scenario that analysts were already debating in late September. |
| 58,000 to 60,000 | Area of the 2026 low, a reference point rather than a forecast. |
Momentum is fading but not broken. Daily RSI dropped to 52.84 from 63.45, still just above neutral.
What would change the picture
A daily close back above roughly $84,400 would suggest this was mostly a leverage flush. A close below $82,570 would put the $80,800 to $80,000 area in play. The next catalysts are ETF flow direction, oil and the CPI print on October 14.
FAQ
Will Bitcoin keep falling?
Unknown. Liquidation-driven drops often fade quickly, but this one also has macro and ETF flow pressure behind it.
Why are altcoins falling too?
Deleveraging hits the whole market. Ethereum is down 1.9% over 24 hours.
Is this a good time to buy?
That depends on your strategy and risk tolerance. This article gives facts, not recommendations.
Disclaimer: This content is for information only and is not investment advice. Leveraged crypto trading can result in the loss of your entire stake.
Sources
- The Crypto Times, 8 Oct 2026 (price, support zone, ETF outflows, open interest): https://www.cryptotimes.io/2026/10/08/bitcoin-price-today-tests-82k-support-as-etf-outflows-hit-487m/
- The Crypto Times, 7 Oct 2026 (liquidations): https://www.cryptotimes.io/2026/10/07/bitcoin-price-today-btc-falls-to-84k-as-546m-liquidations-etf-outflows-hit-before-fed/
- CryptoNews, 8 Oct 2026 (Fed minutes, oil, yields): https://cryptonews.com/news/bitcoin-price-prediction-oil-yields-hawkish-fed
- The Crypto Basic, 8 Oct 2026 (technical levels, RSI): https://thecryptobasic.com/2026/10/08/crypto-price-analysis-btc-eth-jup-ray-and-near-october-8-bitcoin-and-ethereum-retreat-as-jupiter-and-raydium-advance
- Analytics Insight, 8 Oct 2026 (WazirX levels, whale buying, CPI date): https://www.analyticsinsight.net/price-analysis/crypto-prices-today-bitcoin-slips-to-usd-82900-as-treasury-yields-liquidations-test-support
- Coingabbar, 8 Oct 2026 (Fear & Greed Index, ETH move): https://coingabbar.com/en/crypto-news-today-october-8-2026-bitcoin-ethereum-price-falls
- Bitcoin.com, 24 Sep 2026 (analyst debate on $70K and $80K): https://news.bitcoin.com/market-updates/bitcoin-price-stalls-at-84k-as-80m-long-liquidation-wave-hits/
- CoinGate, 23 Jul 2026 (2026 low near $58K): https://coingate.com/gift-cards/articles/article/why-is-bitcoin-dropping-the-real-reasons-behind
About the author
Marcus Reed
80 articlesTrending

Best Craps Strategy for Beginners: 3 Steps to Start Right
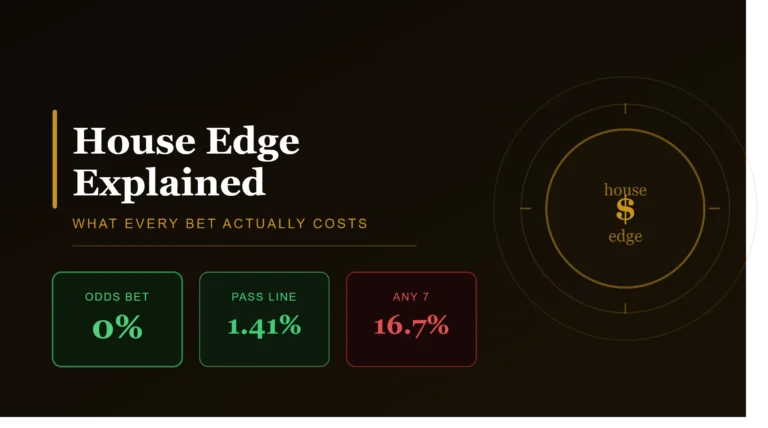
Craps House Edge Explained: What Every Bet Actually Costs

Craps vs Sic Bo: Which Dice Game Should You Play?

Best Way to Win at Craps – Realistic Tips That Actually Work




![Casino Reels – Definition and Meaning [GUIDE]](https://wolfbet.com/blog/wp-content/uploads/2025/02/casino-reels-768x768.webp)